


From data to decisions, reimagine quantitative investing


Understand market sentiment & today's opportunities in 30 seconds.
Swipe to verify your trading strategy.
Every piece of data ultimately points to a clear decision.
Free from emotion and subjective bias
Every decision is governed by clear trigger conditions, ensuring consistent and rational investment behavior and avoiding chasing gains and selling into declines.


Backtestable
Any quantitative model can be backtested on historical data to quickly evaluate key indicators such as the strategy's profitability, maximum drawdown, and win rate across different market environments. This allows you to know the strategy's fundamentals before deploying real capital.

Systematic
Quantitative analysis can simultaneously process hundreds of stocks, cryptocurrencies, and thousands of factors including momentum, value, volatility, and more. Without the need for manual market monitoring, the system automatically scans the entire market, generates trading signals, and captures scattered opportunities.
Disciplined
Once a quantitative model has its rules set (such as "buy when RSI is below 30 and sell when above 70"), it will execute unconditionally. This avoids the common "wait a bit longer" and "let's see" psychology in manual trading, ensuring that the long-term effectiveness of the strategy is not undermined by execution deviations.
Risk Controllable
Quantitative analysis can calculate risk metrics such as portfolio volatility, VaR (Value at Risk), Sharpe ratio, and maximum drawdown in real time. It allows you to anticipate potential losses under extreme scenarios in advance and set up automatic stop-loss or hedging mechanisms to confine risks within an acceptable range.

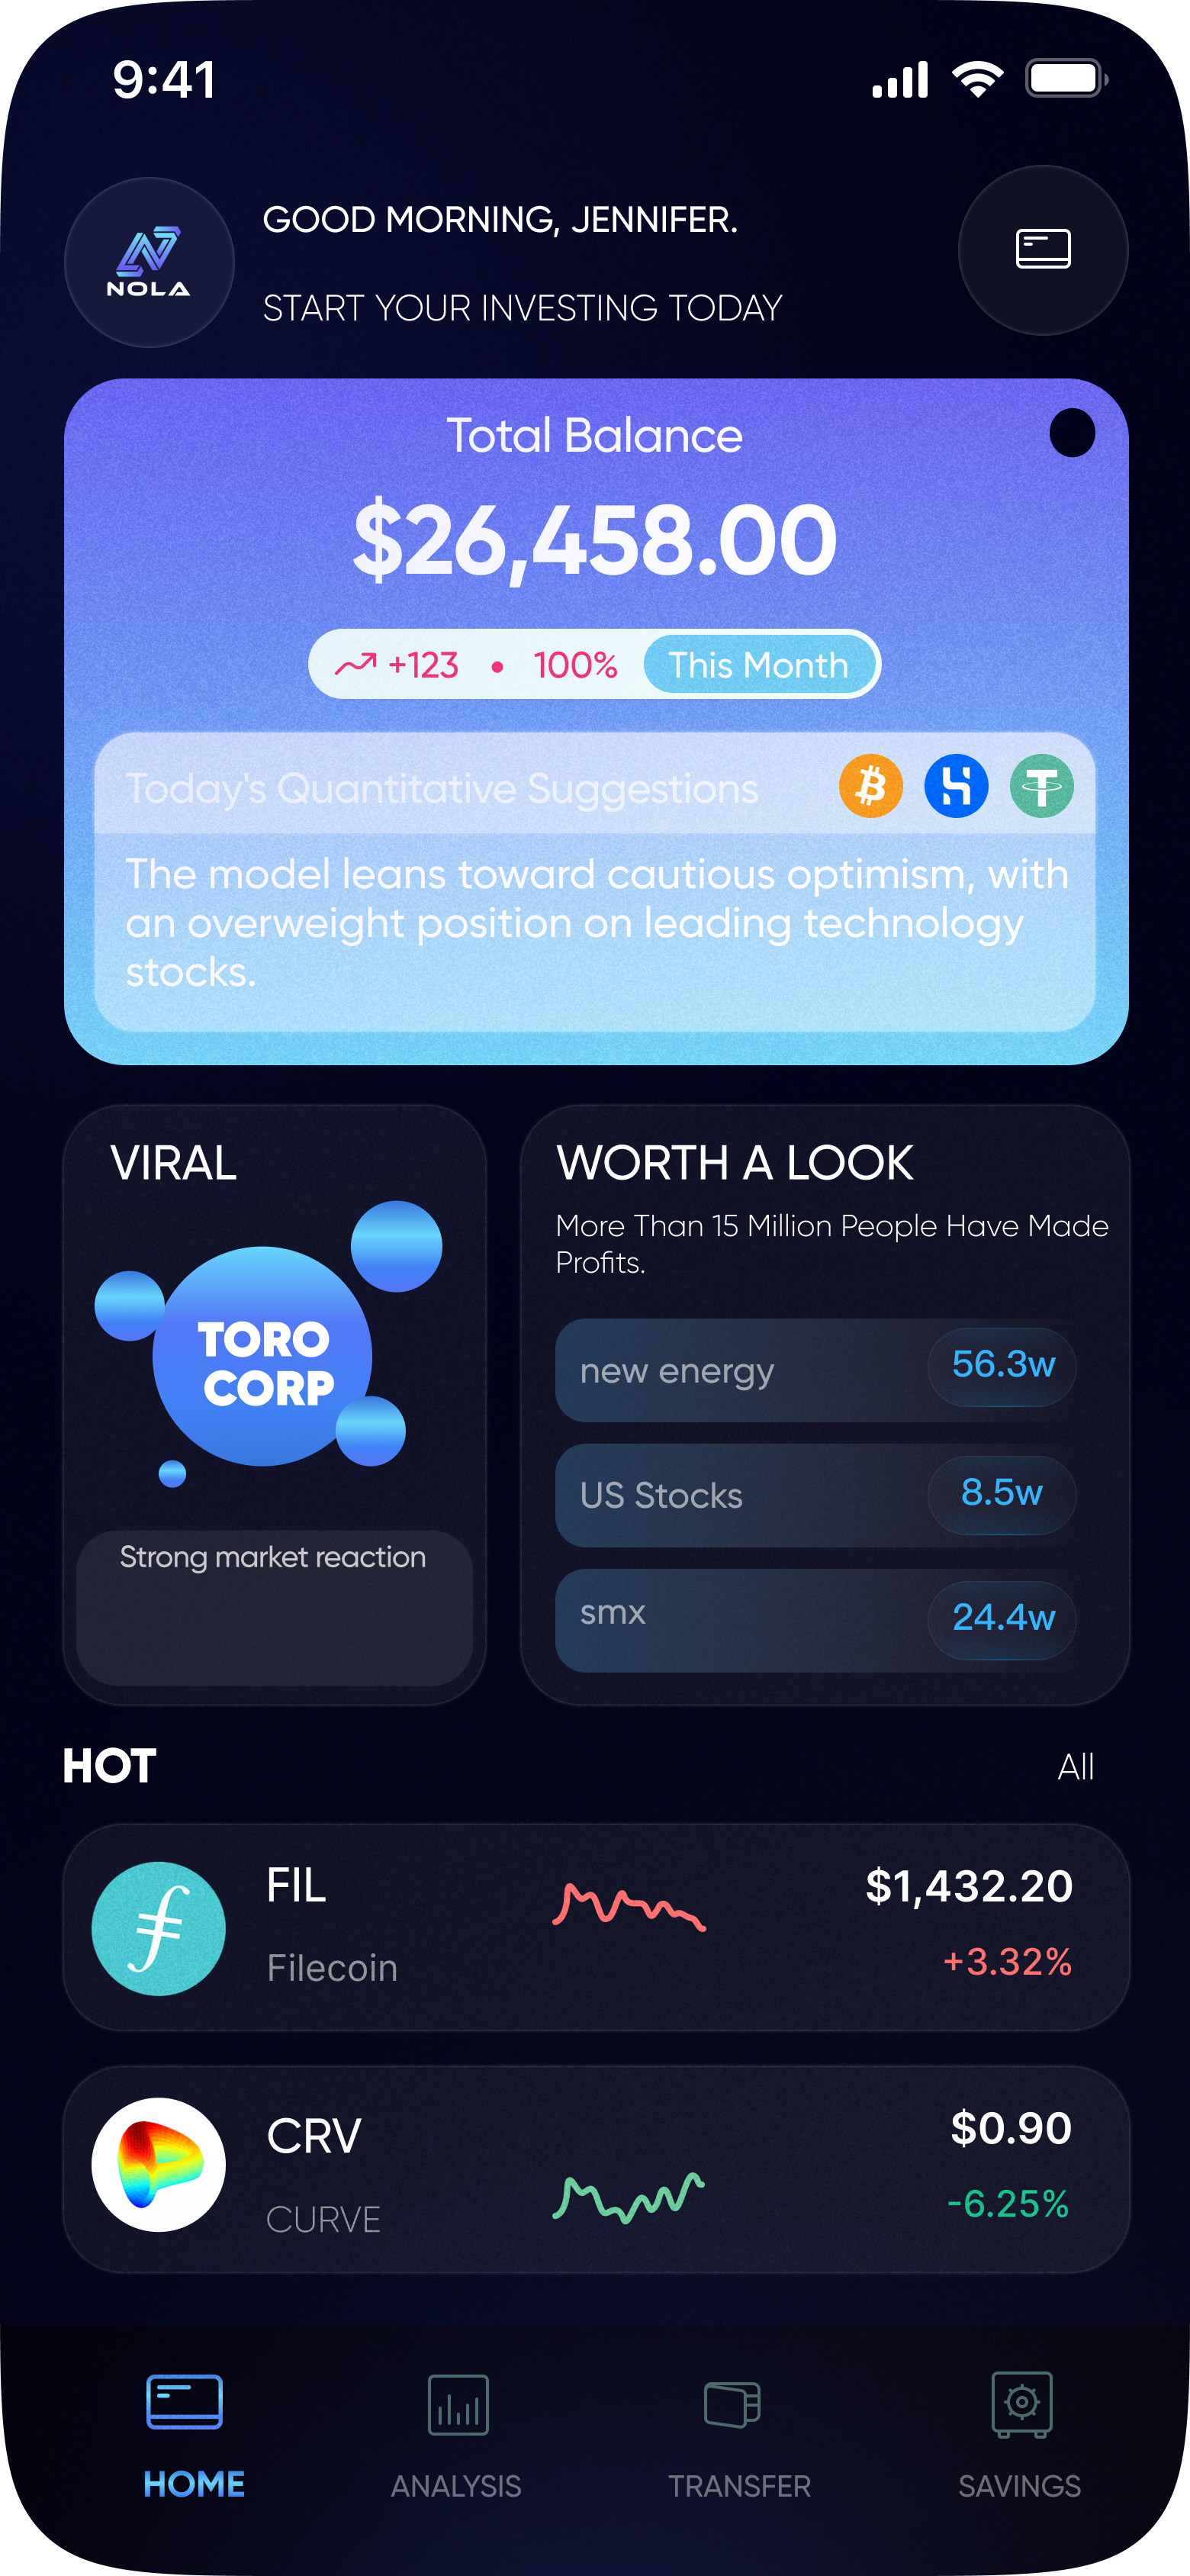
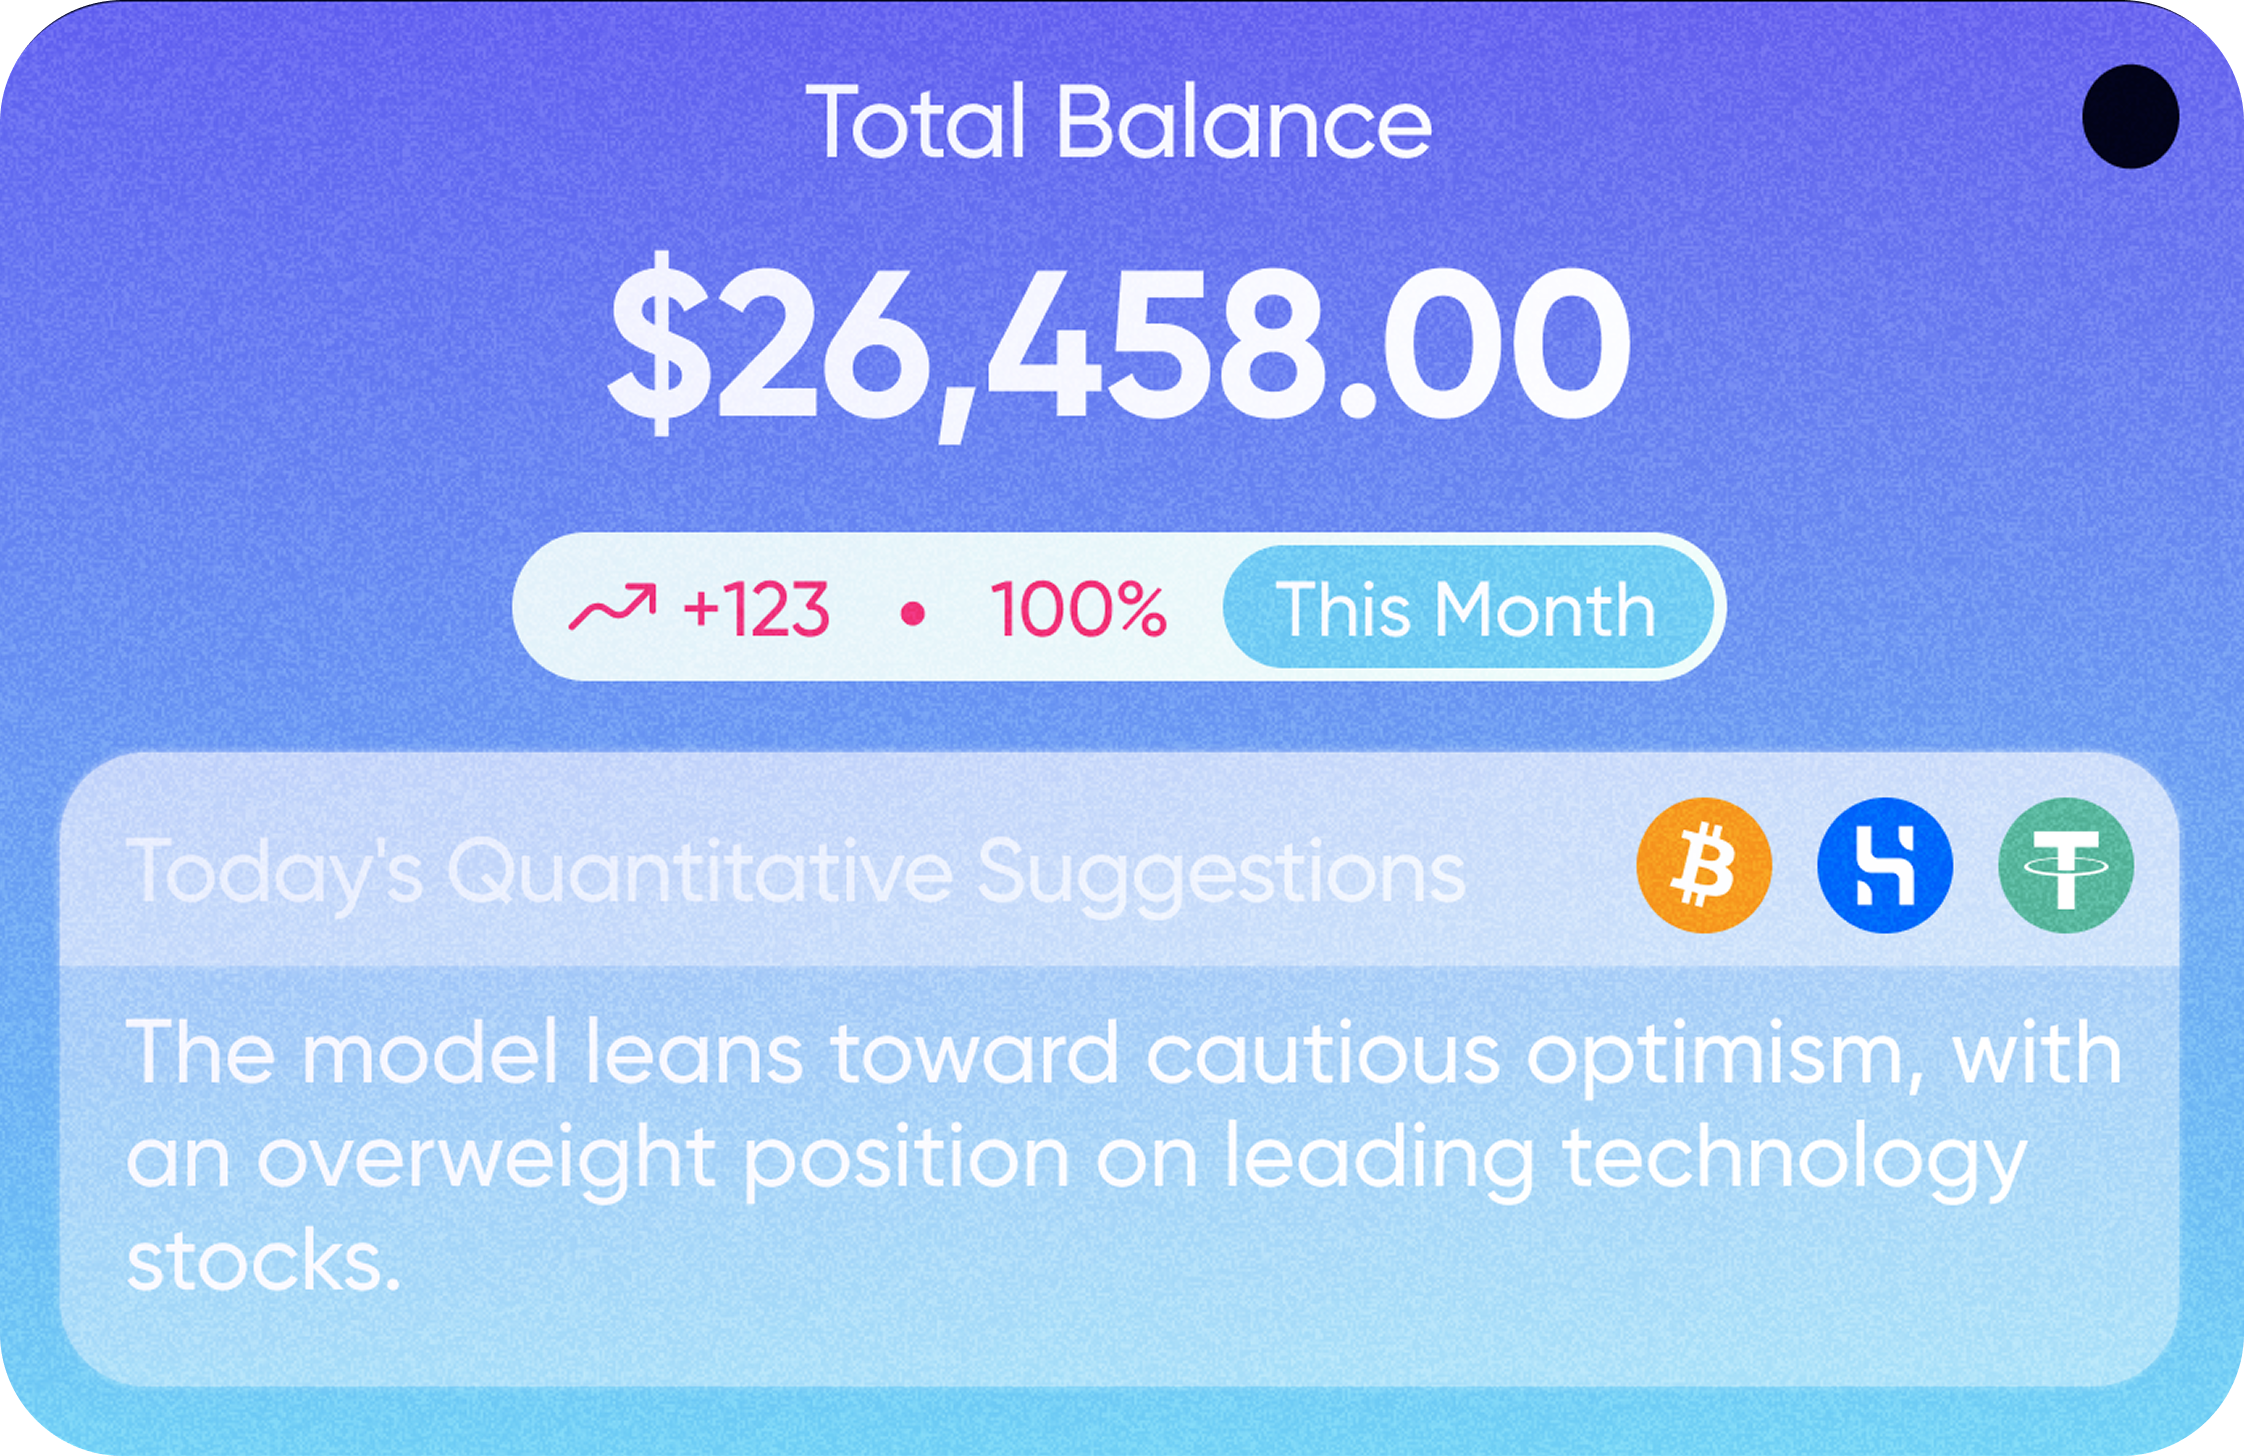
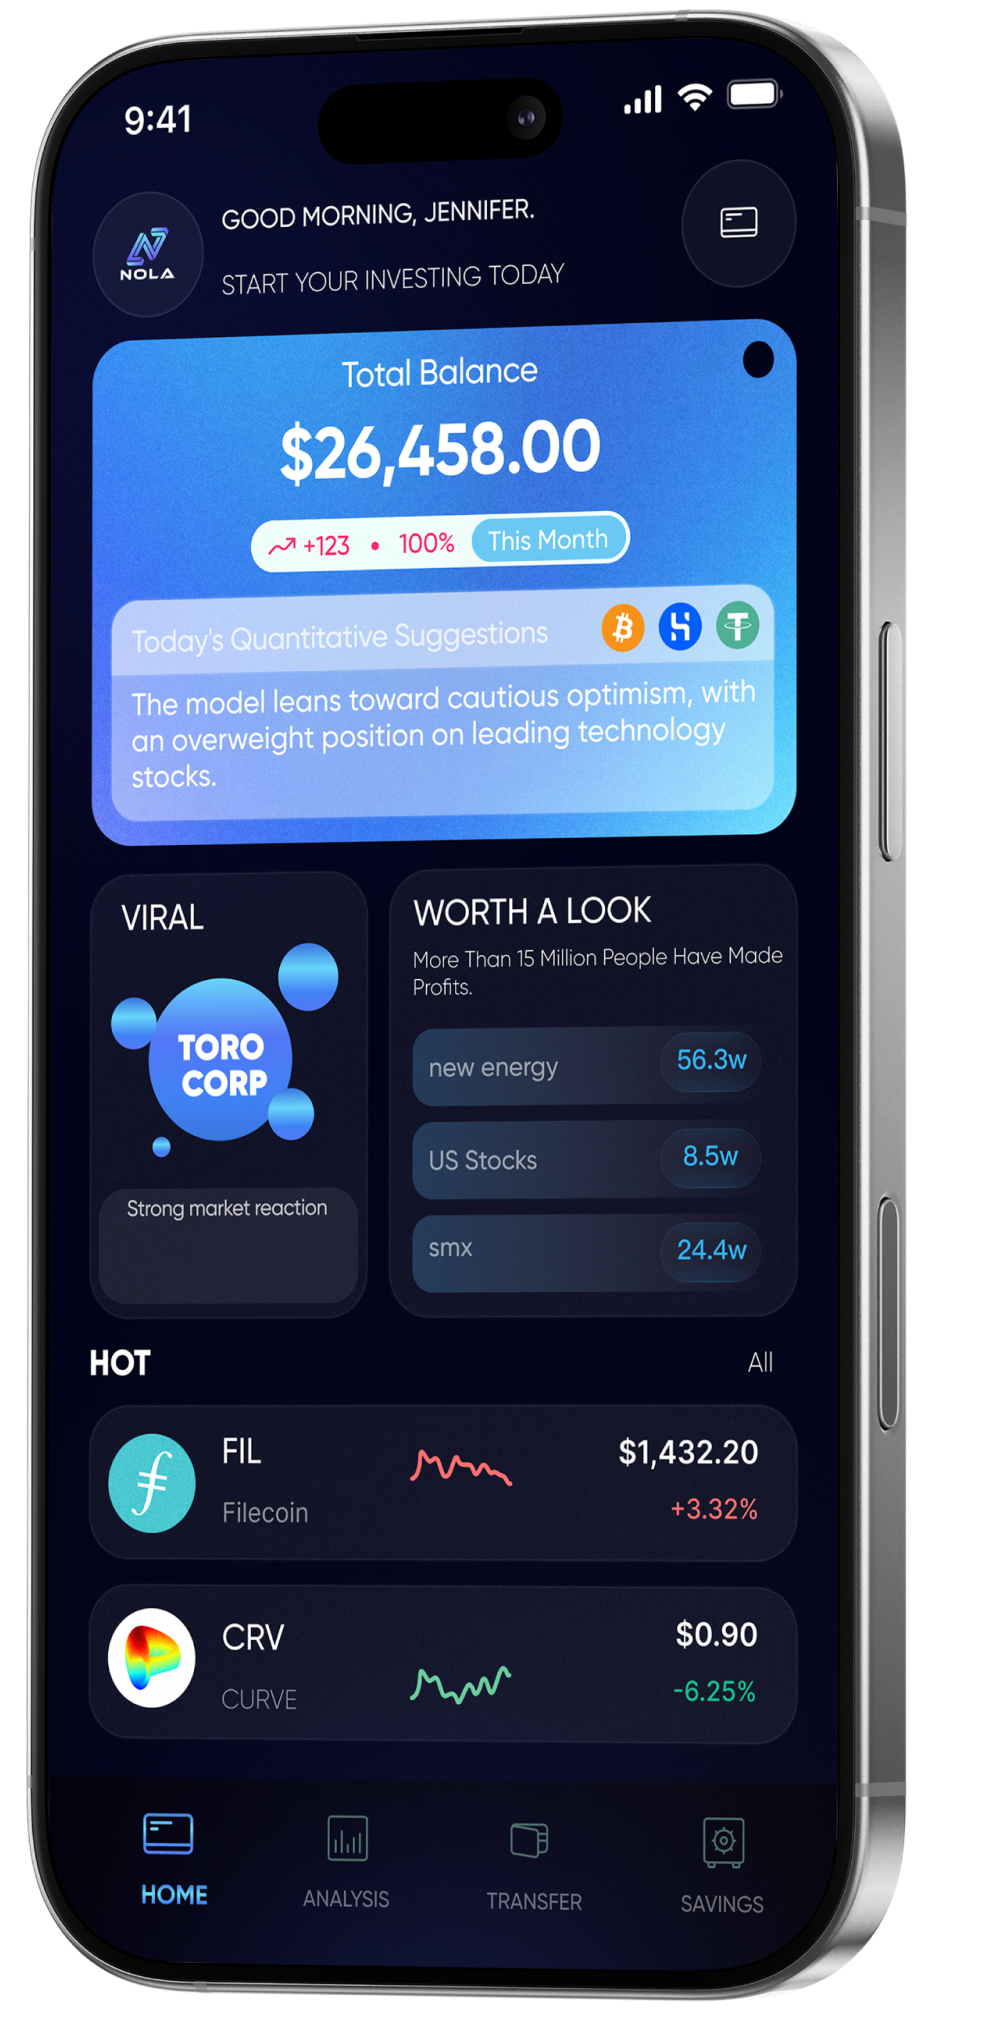
Quantitative Market Overview
At a glance, grasp overall market sentiment and opportunities.
The Quantitative Market Overview intuitively presents overall market sentiment, capital flows and sector rotation through multi-dimensional data indicators. It condenses complex market conditions into a clear and readable global view, allowing users to quickly gauge market temperature,
identify core opportunities and potential risks without complicated analysis. This greatly improves decision-making efficiency and achieves the practical effect of understanding the market at a glance and accurately grasping market rhythm.
The model automatically generates a one-sentence investment strategy (e.g., "Increase holdings of tech leaders and participate in Bitcoin's rebound with low leverage"), along with position size references and risk ratings, giving you a clear starting point for your trades every day.
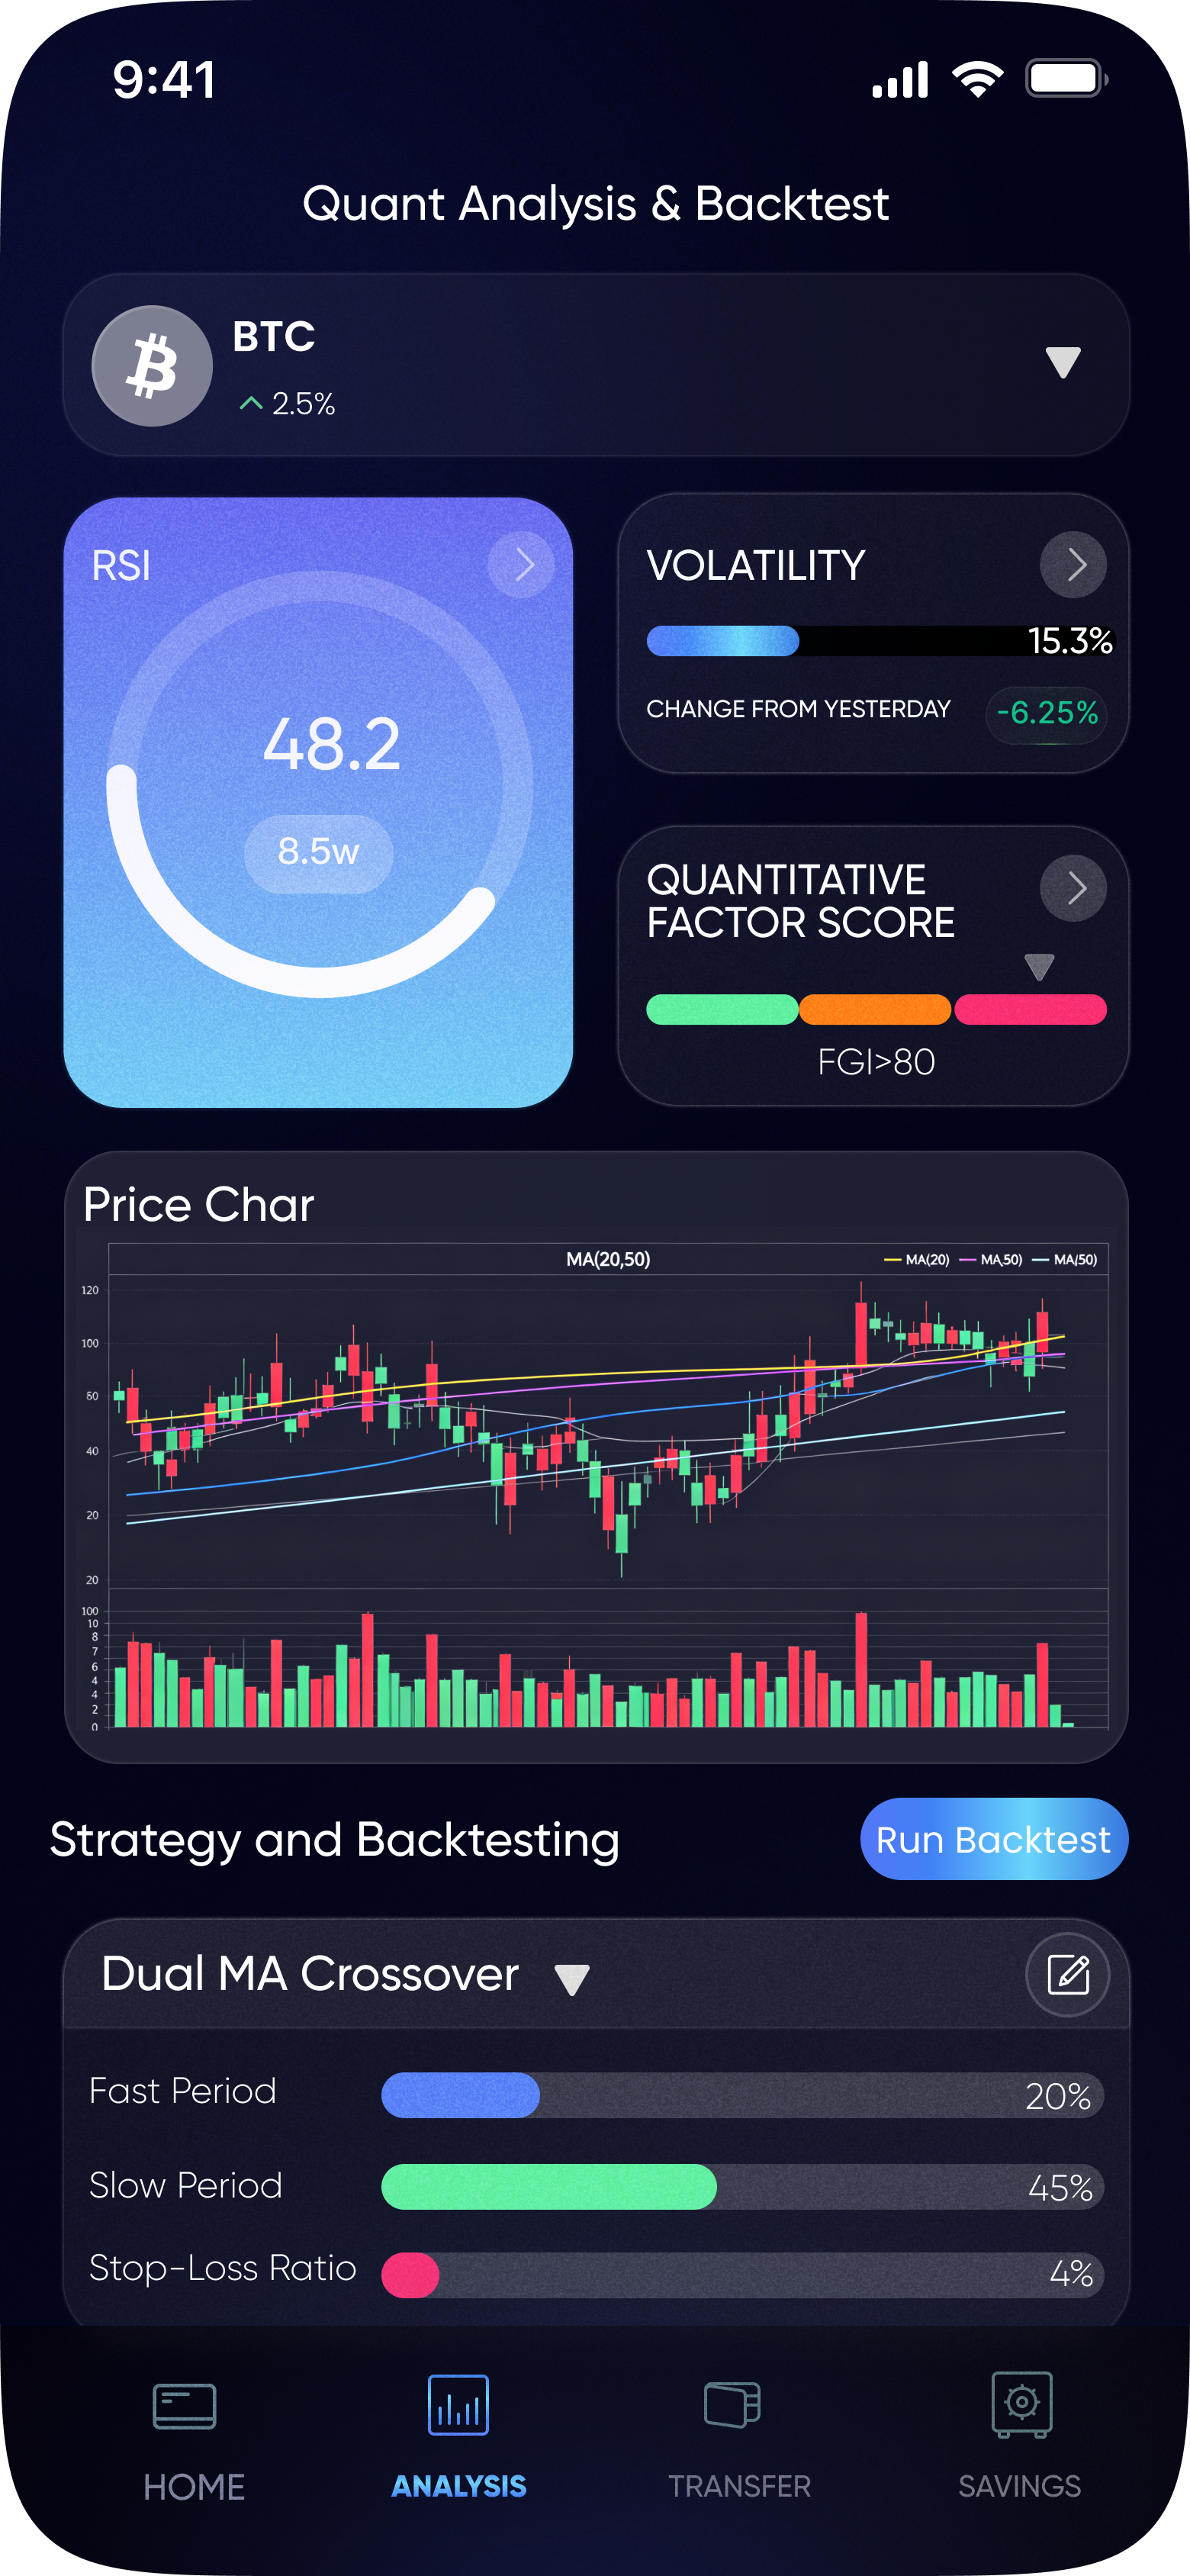
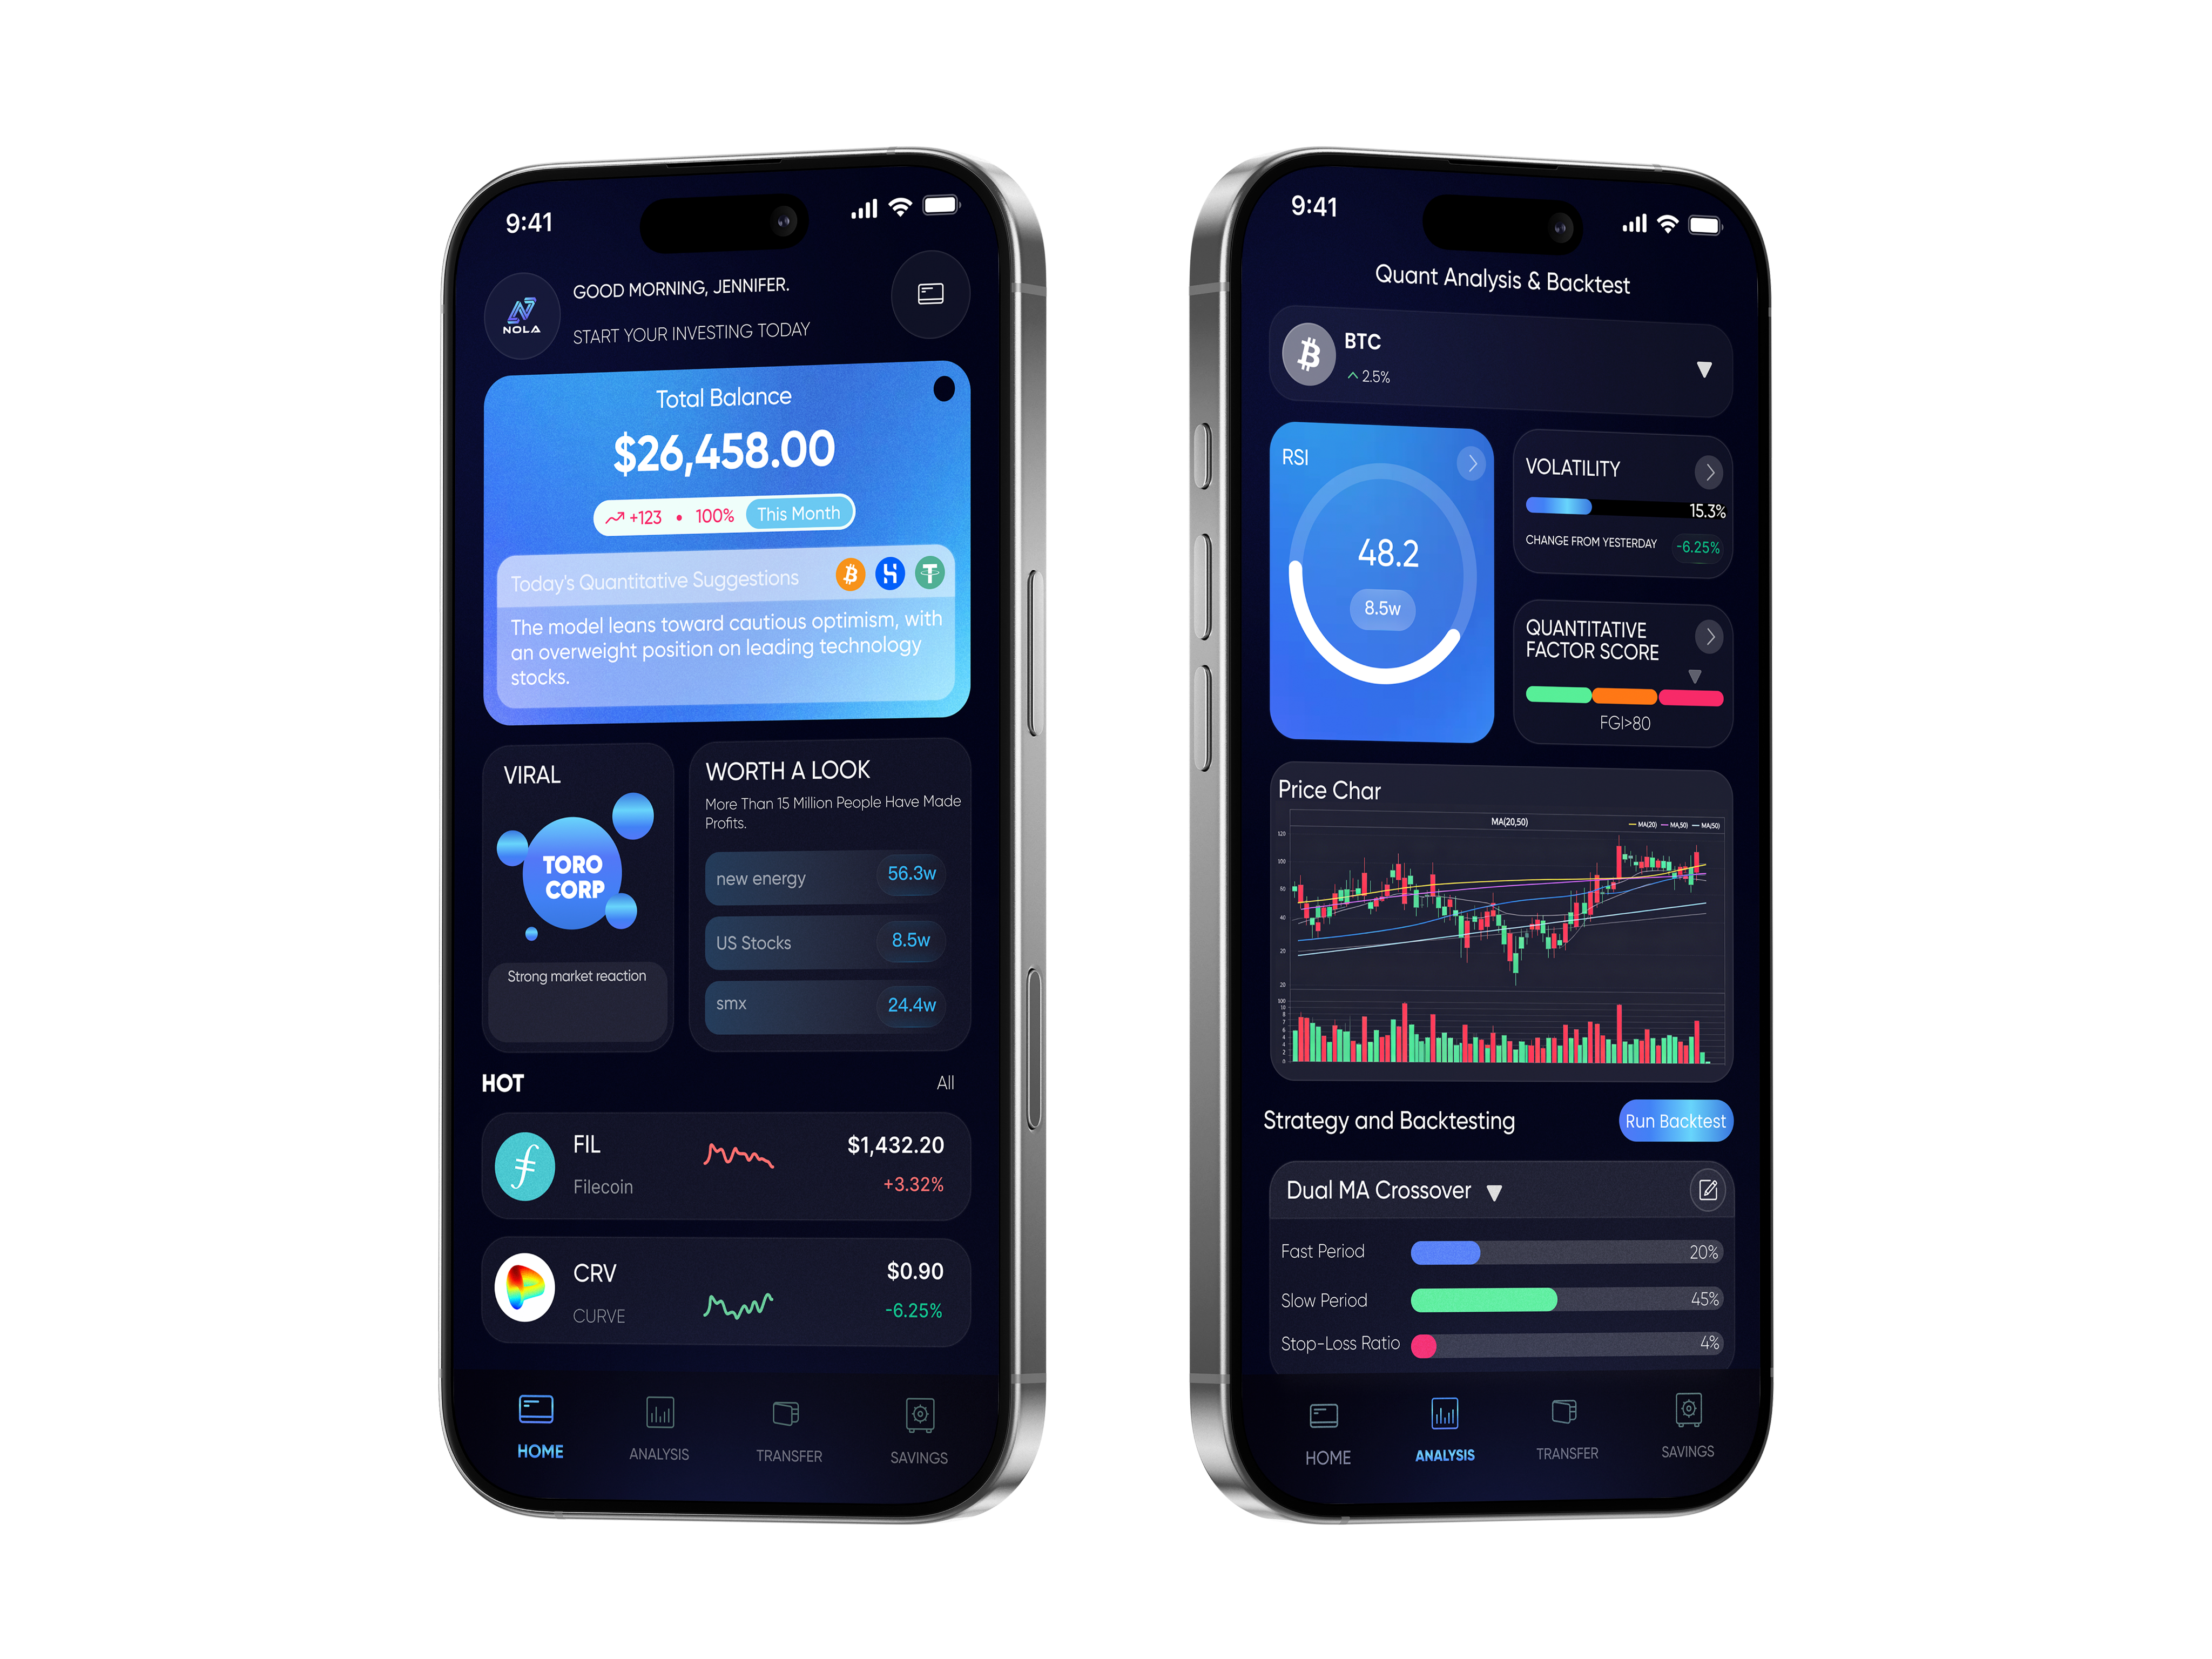
Quantitative Analysis & Strategy Backtesting
The Quantitative Market Overview intuitively presents overall market sentiment, capital flows and sector rotation through multi-dimensional data indicators. It condenses complex market conditions into a clear and readable global view, allowing users to quickly gauge market temperature,
Advanced Charting
Candlestick charts / line charts / area charts, supporting MA20/50, Bollinger Bands, and trading volume. Two-finger zoom to adjust time range, long press for cross cursor to read data accurately.
Controllable Risk
Monitor portfolio volatility, drawdown, and VaR in real time. Set stop-loss and take-profit thresholds, receive risk alerts, and adjust position sizing before exposure exceeds your limits.
Strategy
Built-in classic strategies such as dual moving average crossover, RSI threshold, and Bollinger Band breakout, with adjustable parameters (periods, stop-loss, thresholds), and one-click backtesting.
Real-time indicator panel.
RSI, MACD, volatility, quantitative factor scores. Each indicator comes with signal labels (overbought / oversold / golden cross / death cross) and trend arrows.
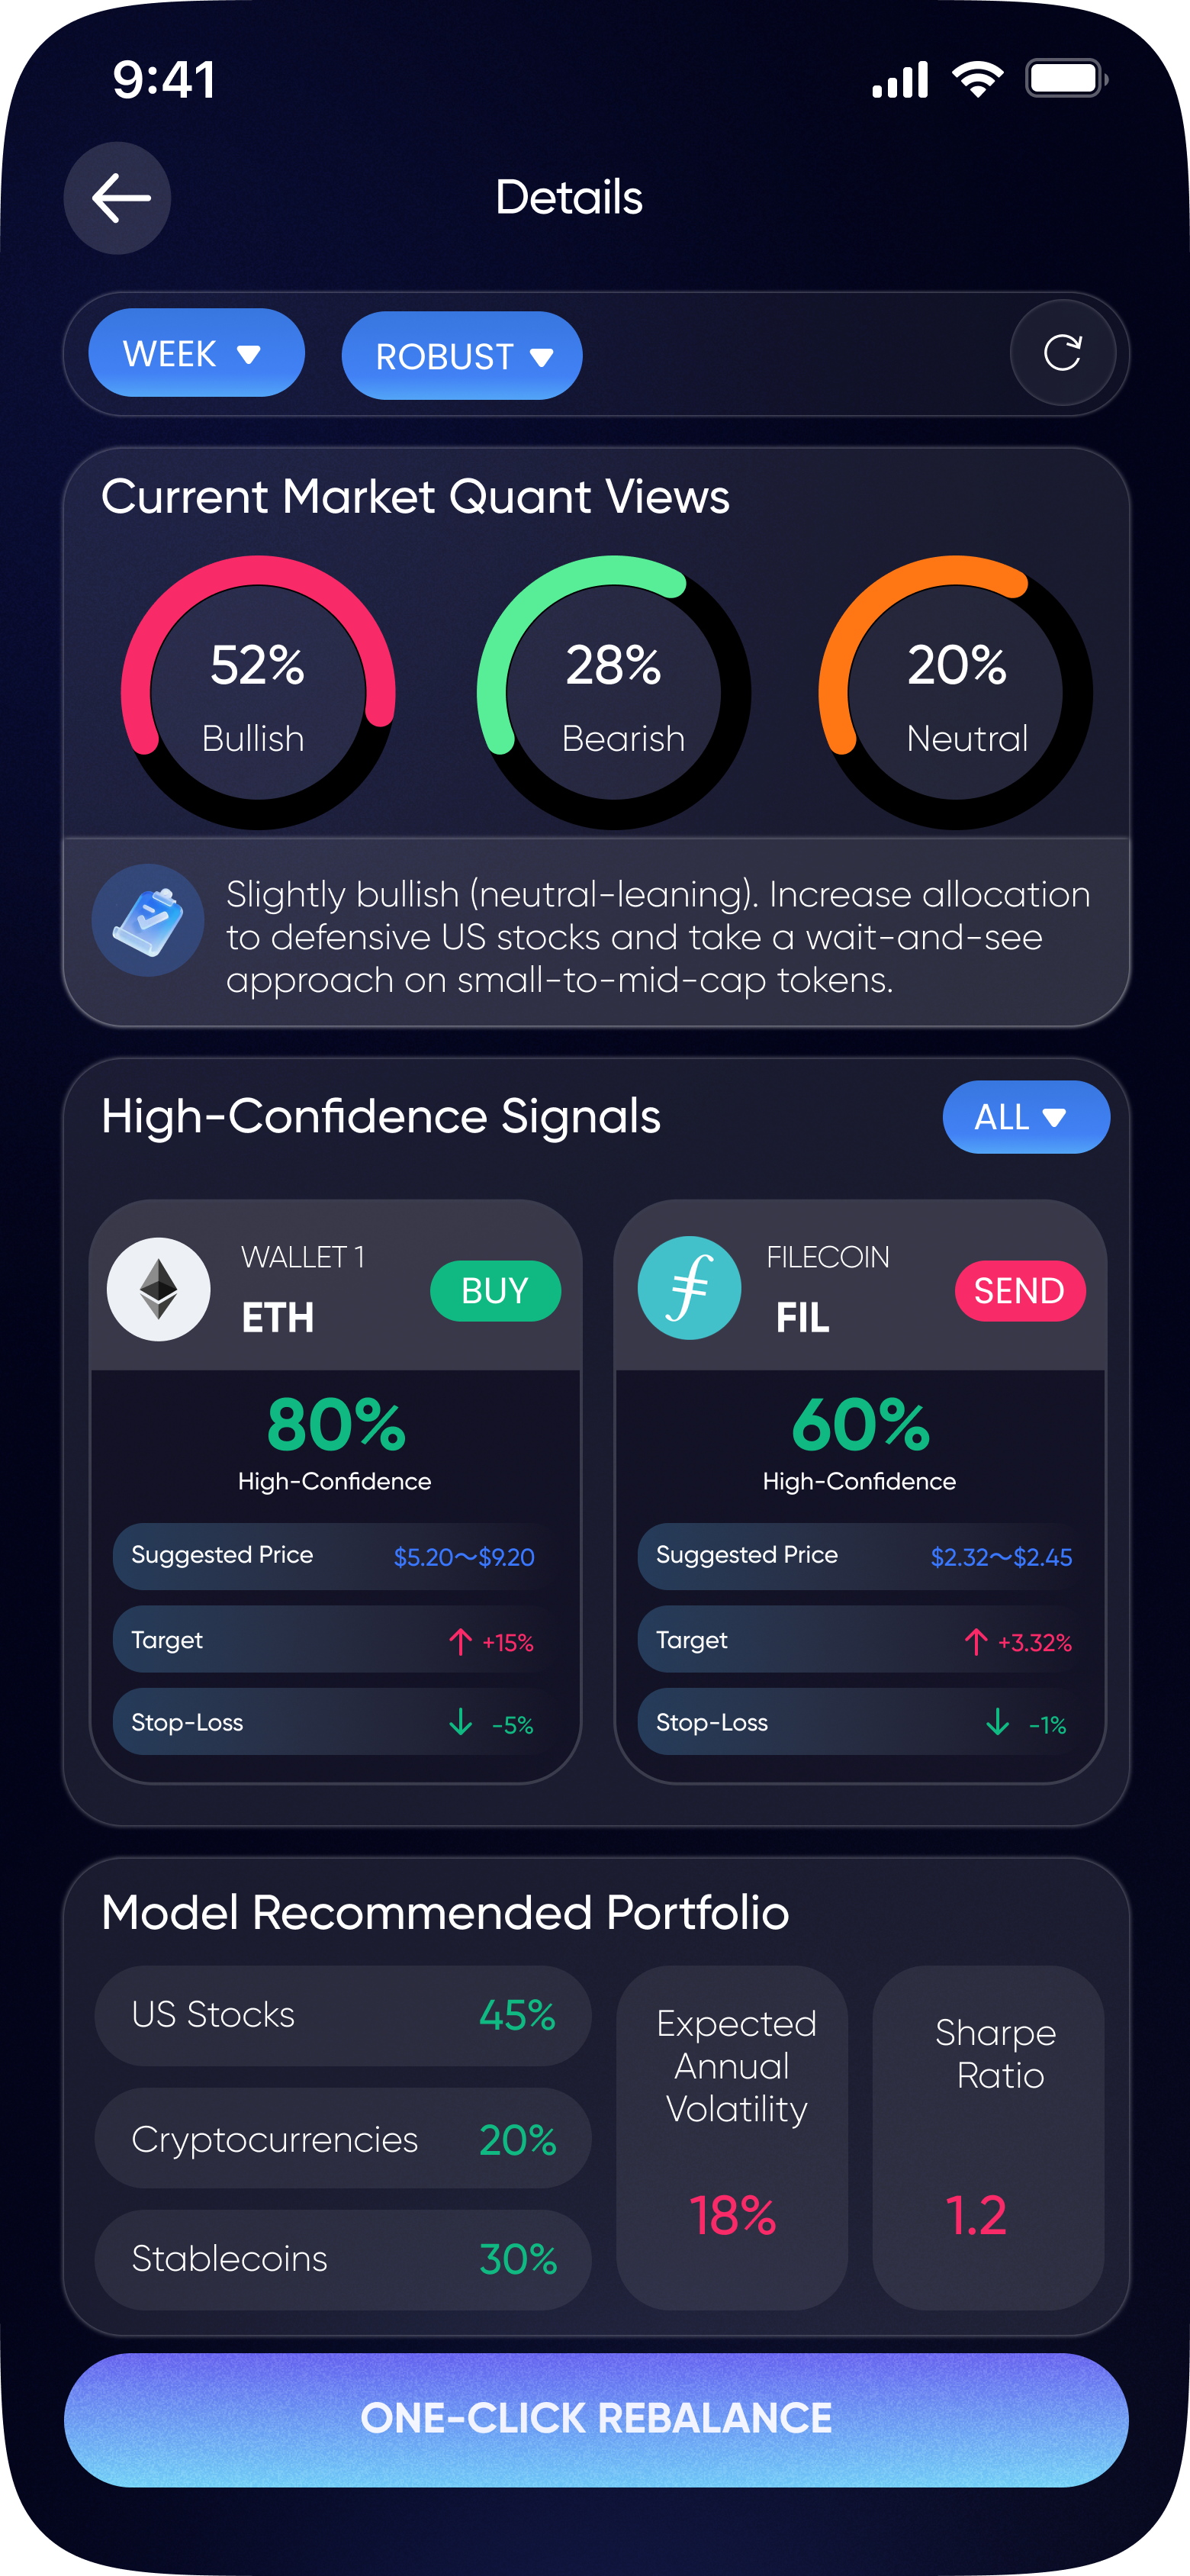
Investment Recommendations & Trading Signals-Make clear decisions and act immediately
Provides multi-dimensional signal tags (such as "Conservative / Aggressive" and "Short-term Swing / Long-term Trend"), while also marking signal strength and confidence level.
You can quickly filter operation suggestions that meet your needs based on your risk tolerance and trading cycle, without spending a lot of time interpreting complex indicators.

Clear Signals

Real-Time Response

Tiered Signals

Lower Trial-and-Error Costs
Get The App Now
Access our platform anytime via the App Store or GooglePlay.